
From Core to Edge.
All in one platform.
All in one platform.
Monitoring & Observability
 End-to-End Full-Stack Visibility
Instant Resource Onboarding with Zero Configuration
AI-Powered Predictive Operations
Business-Driven O&M Collaboration
Cloud-Native Elastic Scalability
Flexible Customization for Any Business
End-to-End Full-Stack Visibility
Instant Resource Onboarding with Zero Configuration
AI-Powered Predictive Operations
Business-Driven O&M Collaboration
Cloud-Native Elastic Scalability
Flexible Customization for Any Business
One Platform to Optimize Your Entire IT Ecosystem
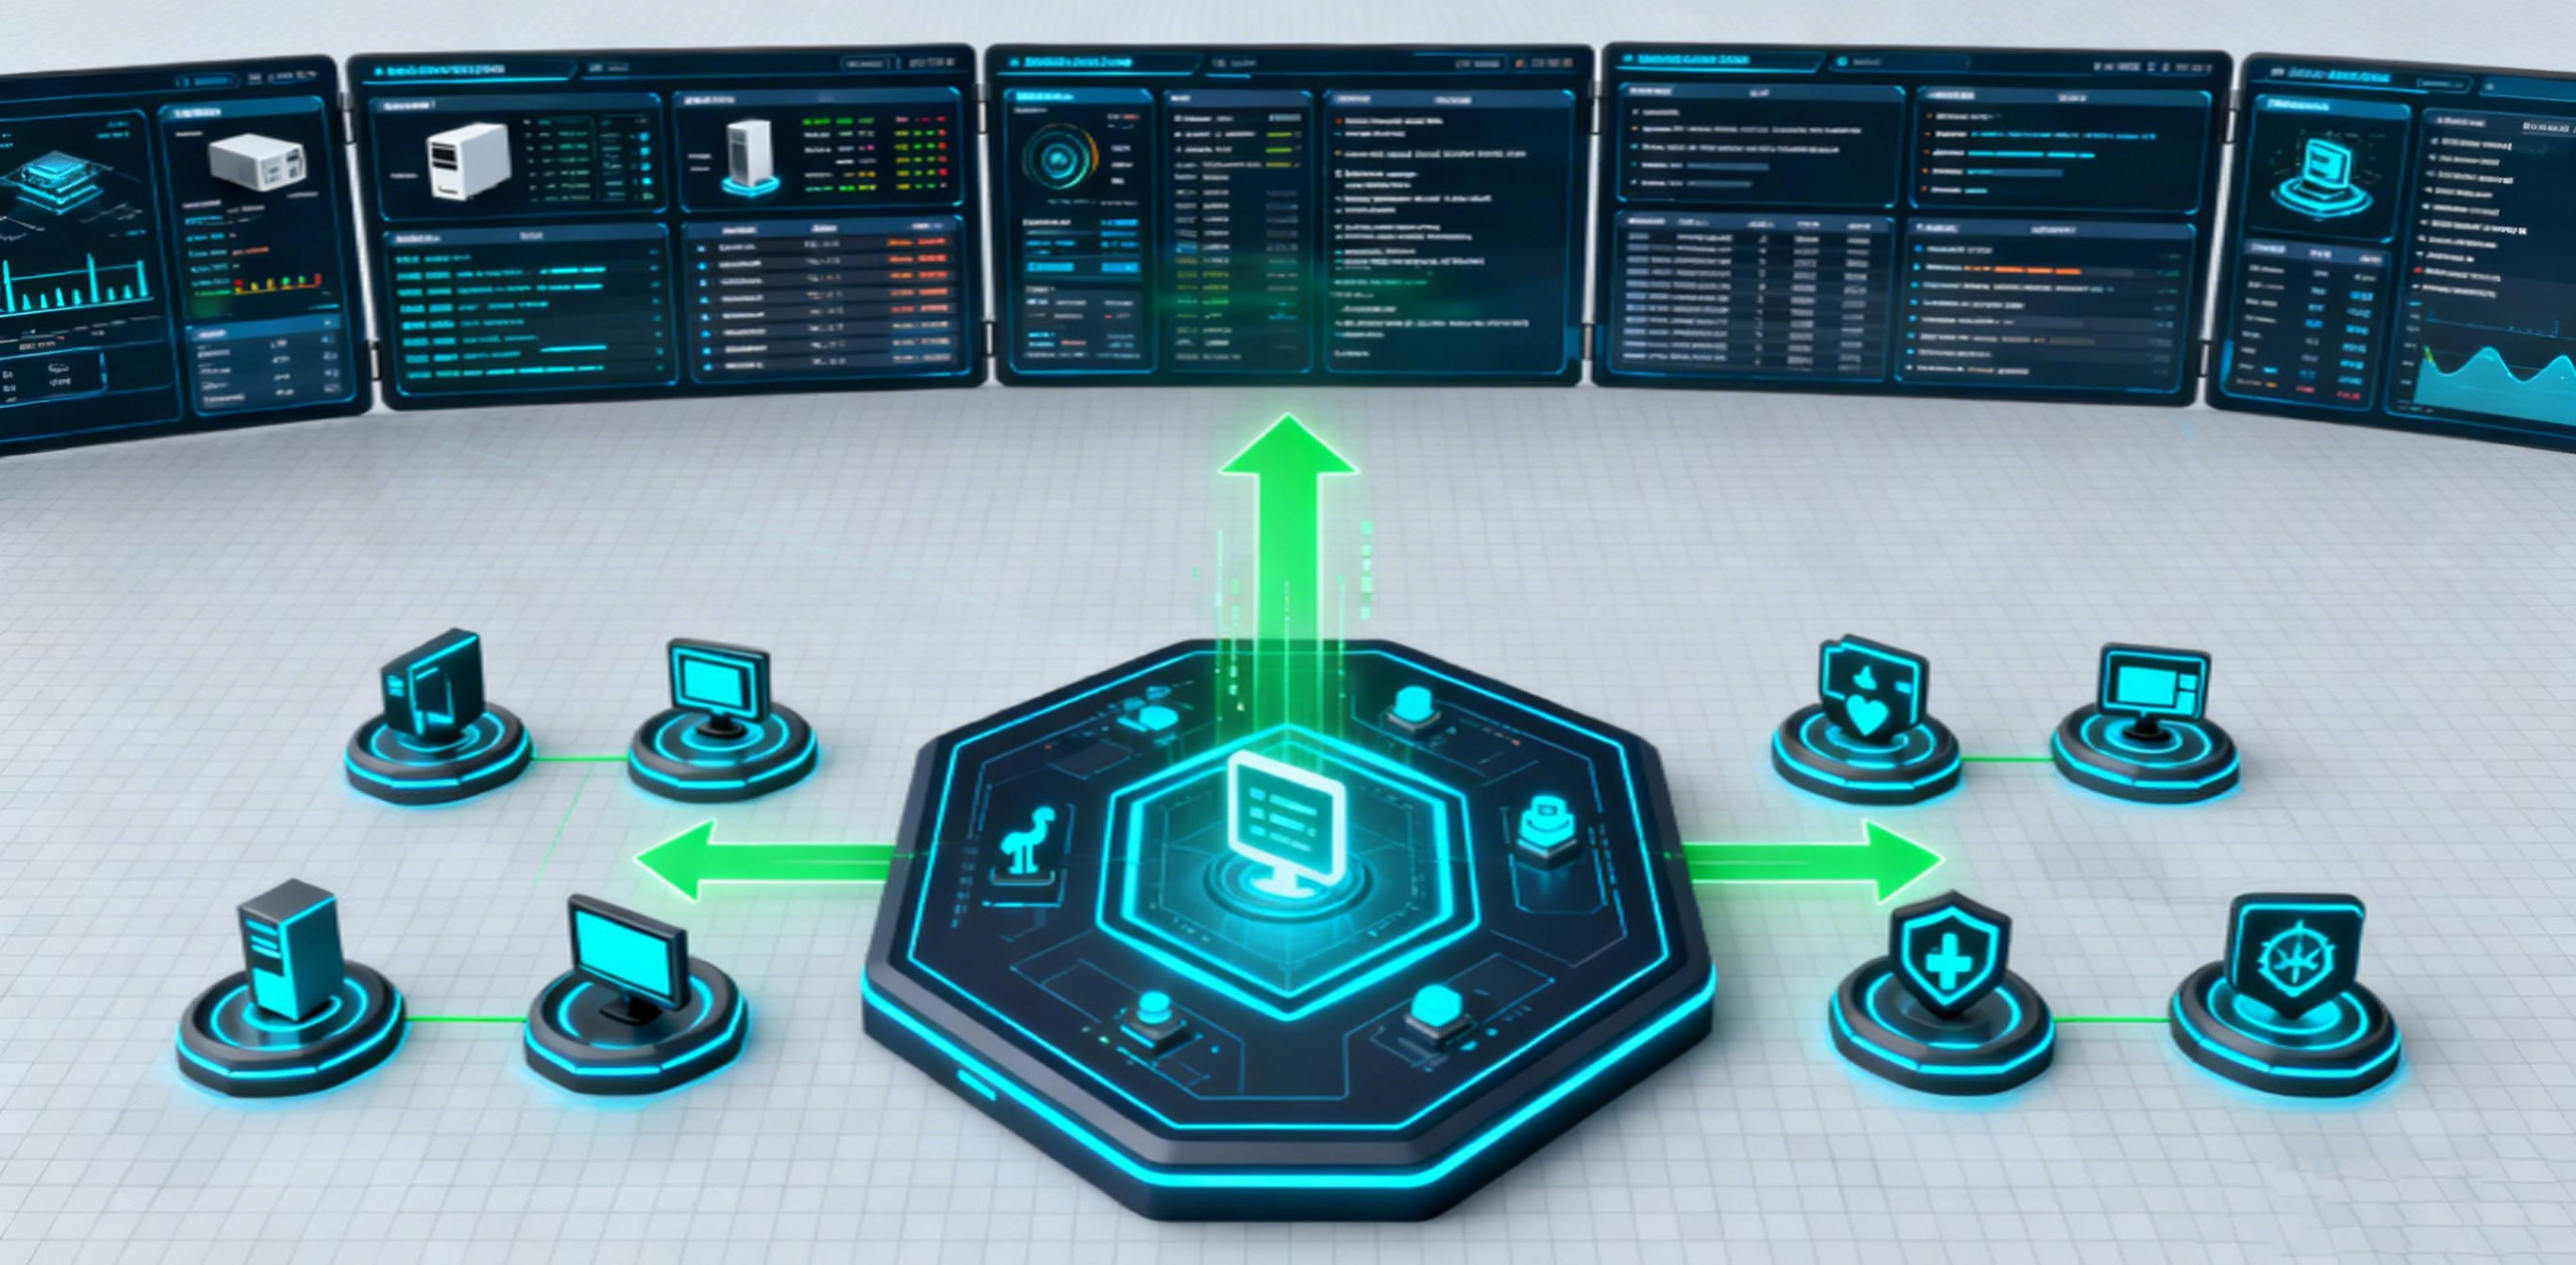
NetcareOne™ ITOM system offers comprehensive monitoring and observability, enabling real-time surveillance of critical IT components such as networks, servers, and also applications. This ensures that businesses maintain round-the-clock control over their IT infrastructure.
Why Choose NetcareOne™ ITOM System
 Comprehensive & User-Friendly

Comprehensive & User-Friendly
· Real-time monitoring for complete observability and proactive issue prevention.
· Quick setup with customizable templates and AI-driven optimization.
· Intuitive dashboards and metrics for clear visualization.
· Multi-language support with seamless system integration.
 Solving Common ITOM Challenges

Solving Common ITOM Challenges
· Alarms are consolidated, prioritized, and organized.
· Root cause analysis is sped up with automated insights.
· Real-time monitoring and AI-driven alarms reduce delays and recovery time.
· Knowledge is centralized through data, reports, and service logs.
 Business-Centric Design

Business-Centric Design
· Enables efficient cross-team collaboration.
· Ensures alignment between IT and business goals.
· Supports flexible configuration of SLAs and workflows.
· Adapts easily to diverse operational models.
· Based on a modular, extensible framework.
· Scalable for long-term business growth.
Business-Centric Design
Business-Centric Design
· Enables efficient cross-team collaboration.
· Ensures alignment between IT and business goals.
· Supports flexible configuration of SLAs and workflows.
· Adapts easily to diverse operational models.
· Based on a modular, extensible framework.
· Scalable for long-term business growth.
Device Monitoring & Management
Infrastructure Monitoring
Real-Time Dashboard
Performance Analysis
Smart Alarms
Service Uptime
Remote Control
Storage Monitoring & Optimization
Storage Utilization
Data Security & Tiered Management
Backup Monitoring
Proactive Insights
Optimization Assistance
CAT(Cloud Automated Testing)Monitoring
Real-Time Network Monitoring
Error Logging & Analysis
Intelligent Alarm View
Visual Reports & Insights
Trace-route Tracking
Web Server Monitoring
Resource Monitoring
Real-Time Health Management
Advanced Security
Scalability Tracking
Network Monitoring & Integration
Internet / WAN Monitoring
Real-time bandwidth usage monitoring
Track traffic trends and detect potential anomalies or peak periods
Monitor line stability and transmission quality
Traffic Analysis
LAN Monitoring
Automatically generate and update network topology maps
Unified monitoring view with labeled device icons
Customizable automation toolkit for inspections, backups, and network diagnosticsng
Intelligent Alarms
Advanced Reporting & Insights
WiFi Monitoring
Centralized monitoring of all WiFi networks for stable signal quality
Comprehensive AP status statistics for performance analysis
Proactive alarms for AP downtime
Scheduled automatic inspections with customizable detailed reports

Database Monitoring
Real-Time Performance Tracking
Monitor key database metrics, including response time, transaction throughput, and lock wait time
Resource Usage Analysis
Analyze CPU, memory, and storage utilization to identify usage patterns and potential bottlenecks
Backup & Recovery Monitoring
Ensure backup integrity and recovery readiness to support data security and business continuity
Security & Compliance Monitoring
Detect unauthorized access and data breaches, issuing timely alarms to maintain data integrity and confidentiality

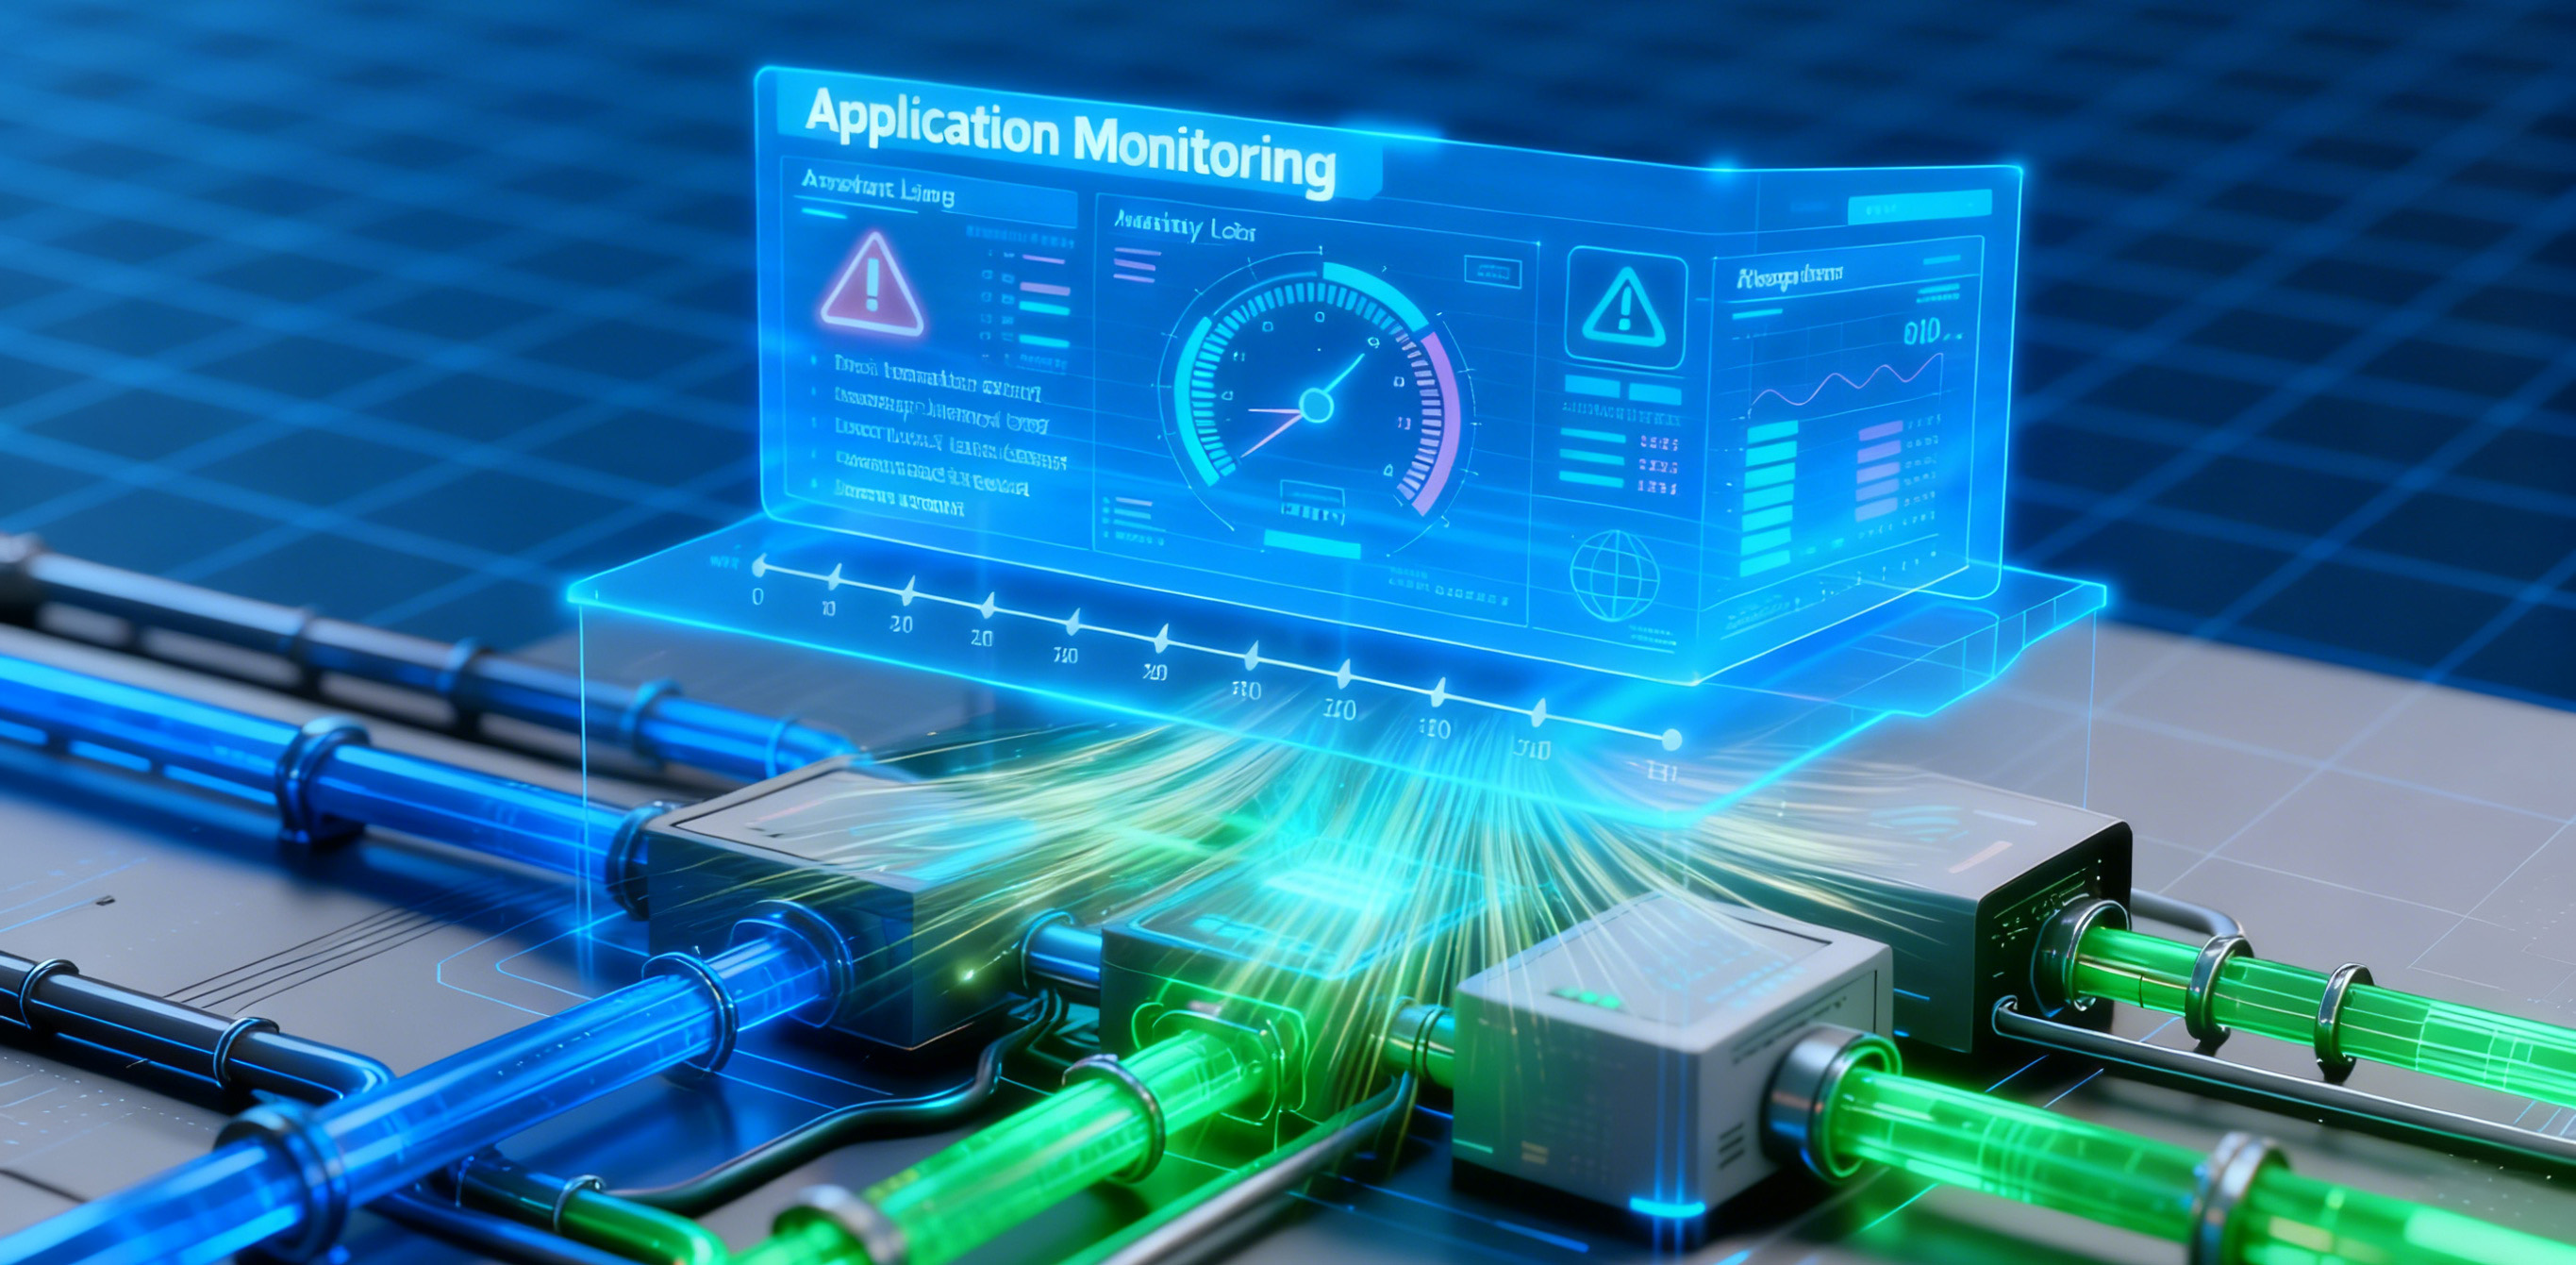
Application Monitoring
Unified Monitoring
Track response time, download speed, and parsing time in real time
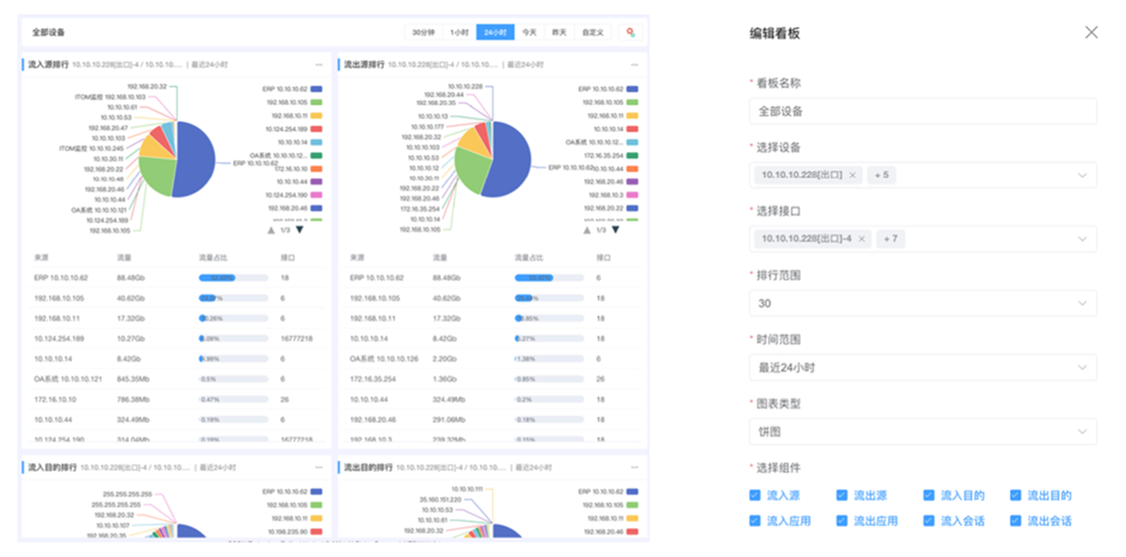
Traffic Intelligence as Part of Observability

Real-Time Monitoring
Visualize live traffic data, including trends and IP distribution


Intuitive Visualization
Use charts and heatmaps to clearly show traffic intensity and distribution

Multi-Dimensional Analysis
Analyze traffic by protocol, application, user, and more

Rapid Bottleneck Identification
Interactive dashboards help quickly pinpoint network congestion
Real-Time Monitoring
Visualize live traffic data, including trends and IP distribution
Intuitive Visualization
Use charts and heatmaps to clearly show traffic intensity and distribution
Multi-Dimensional Analysis
Analyze traffic by protocol, application, user, and more
Rapid Bottleneck Identification
Interactive dashboards help quickly pinpoint network congestion
Automation for Operation
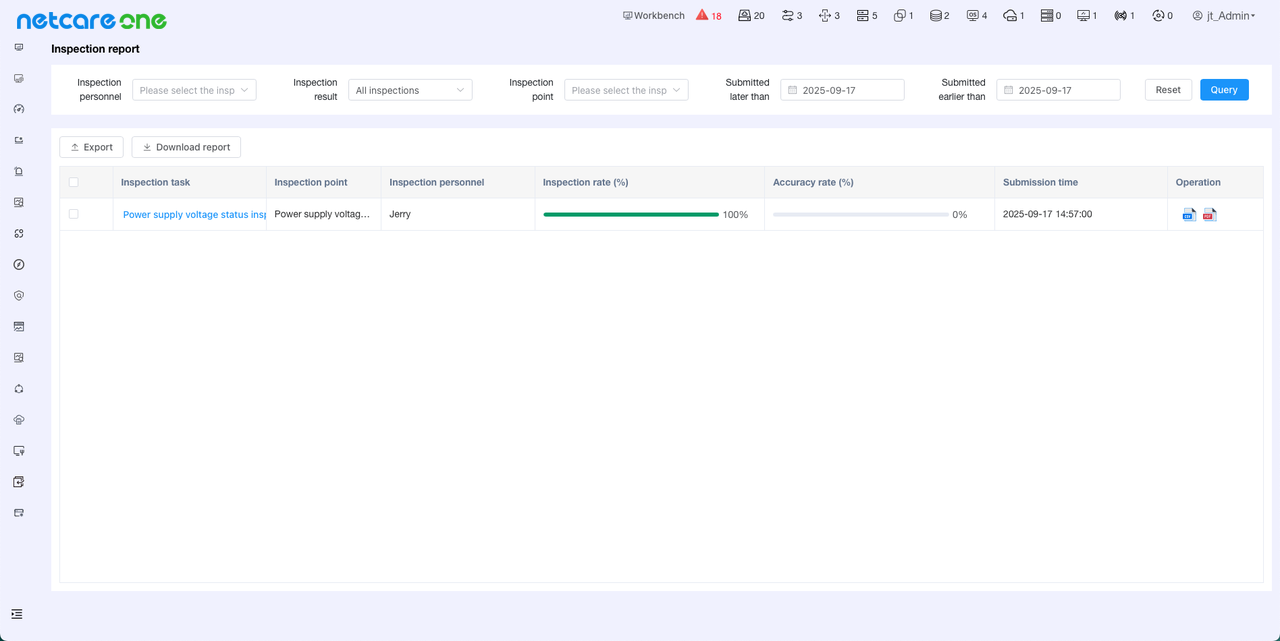
Auto Inspection

SCHEDULING:Create and manage inspection plans with flexible schedules, and view current and upcoming inspections at a glance.
REPORTS:Access, manage, and download detailed inspection reports to track system health and compliance.
TASK MANAGEMENT:Easily create and control inspection tasks, customizing devices, metrics, timing, and reporting methods.
OVERSIGHT:Unified management of inspection points, devices, and metrics for complete visibility and control.
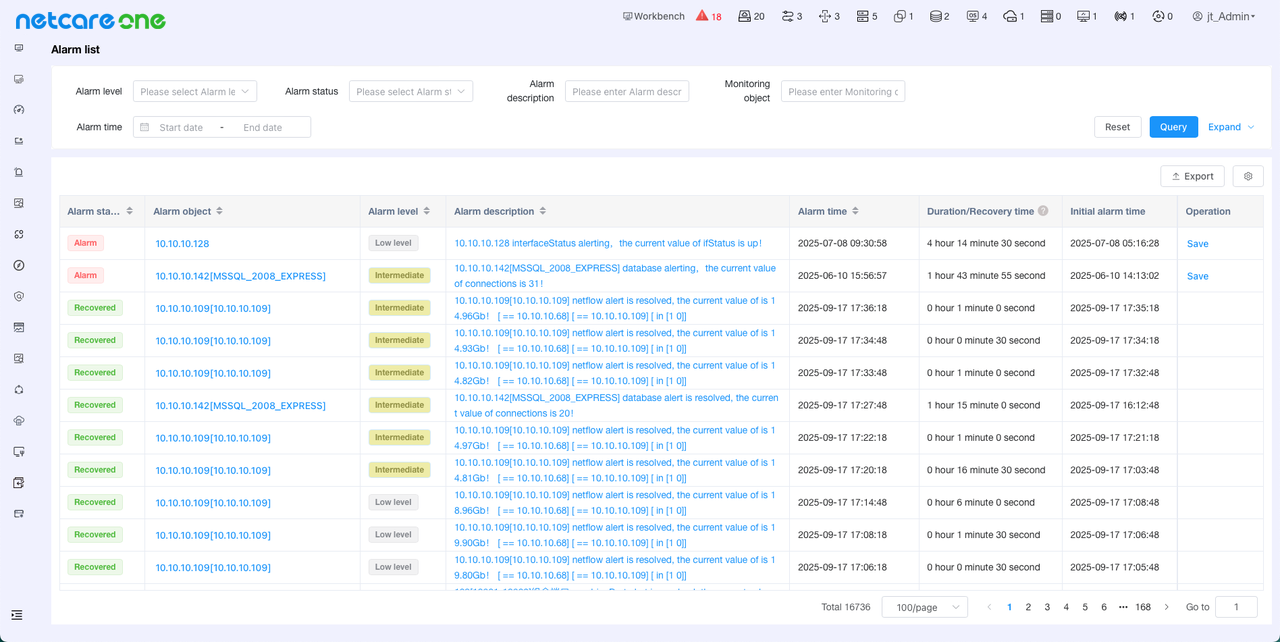
Alarms Management
REAL-TIME:Monitor critical metrics and trigger instant anomaly alerts.
MULTI-CHANNEL:Deliver alerts via email, SMS, or IM for faster response.
CUSTOMIZABLE:Define rules to cut noise and highlight key incidents.
AUTOMATION:Seamless integration with ticketing systems for end-to-end incident management.
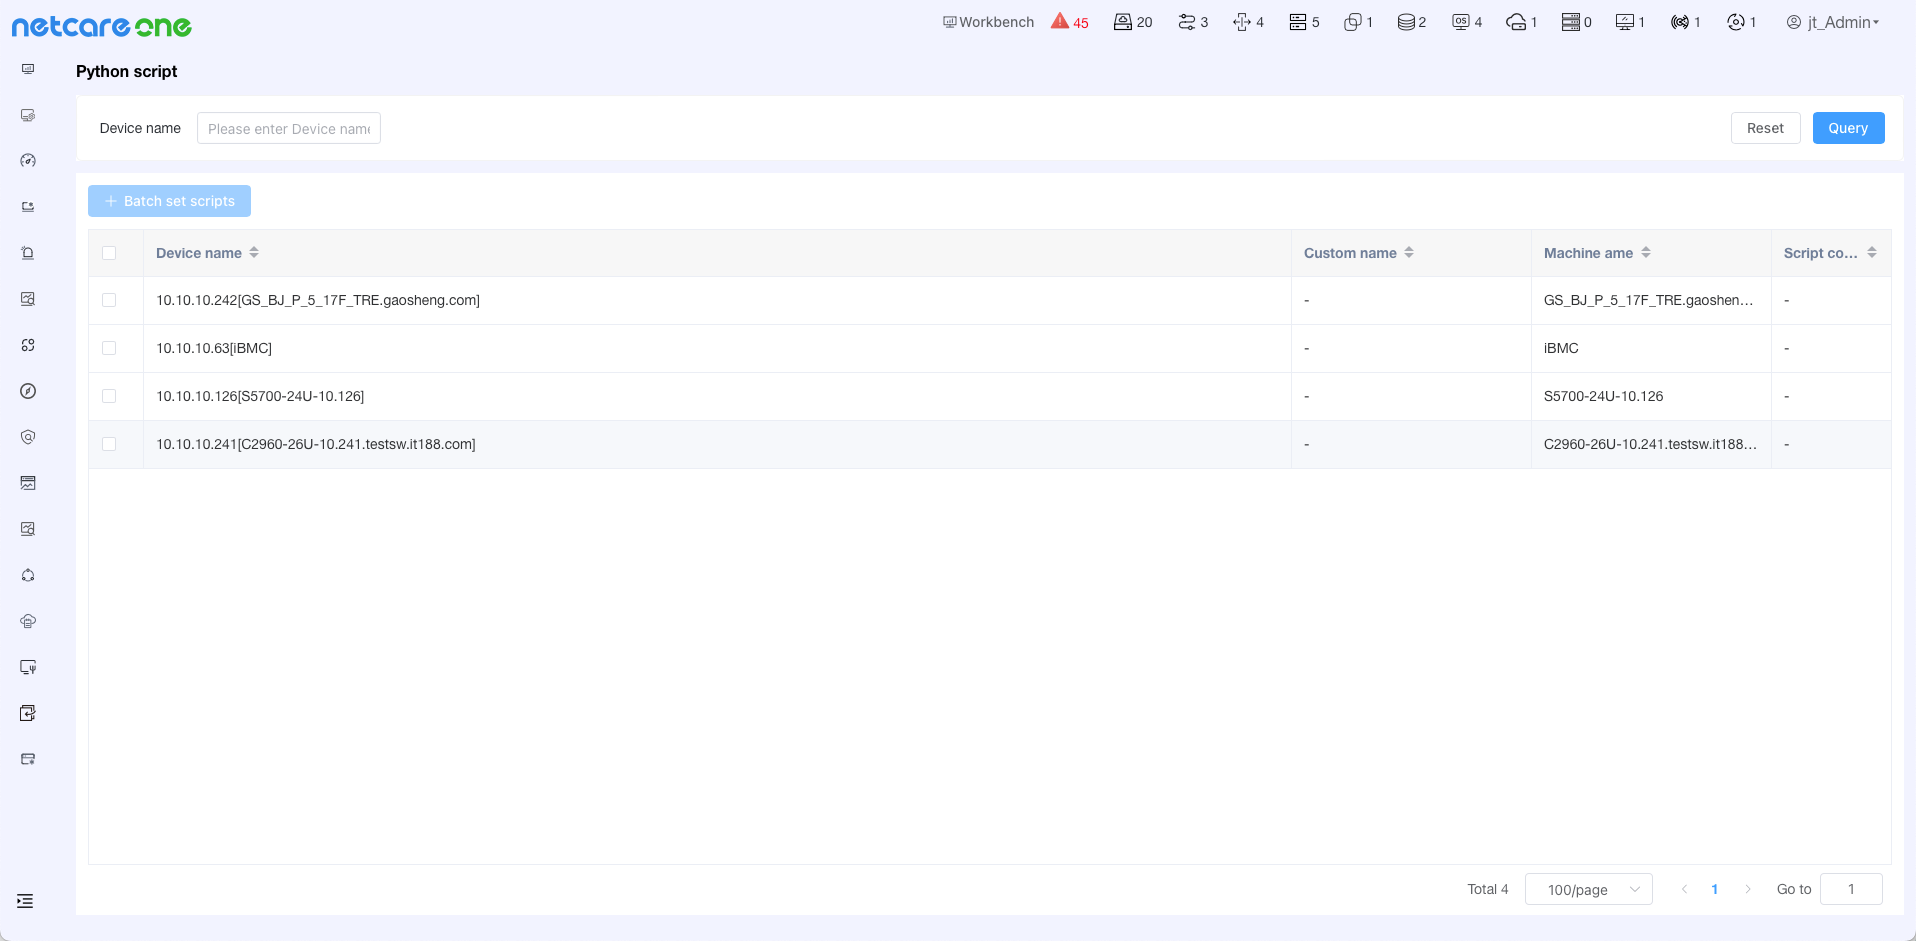
Config Auto-Backup
AUTOMATED:Add and manage device backup rules with support for scheduled automatic backups.
TRANSPARENT:View and download backup records, with support for configuration difference comparisons.
CUSTOMIZABLE:Execute backup tasks using user-defined Python scripts for tailored configuration management.
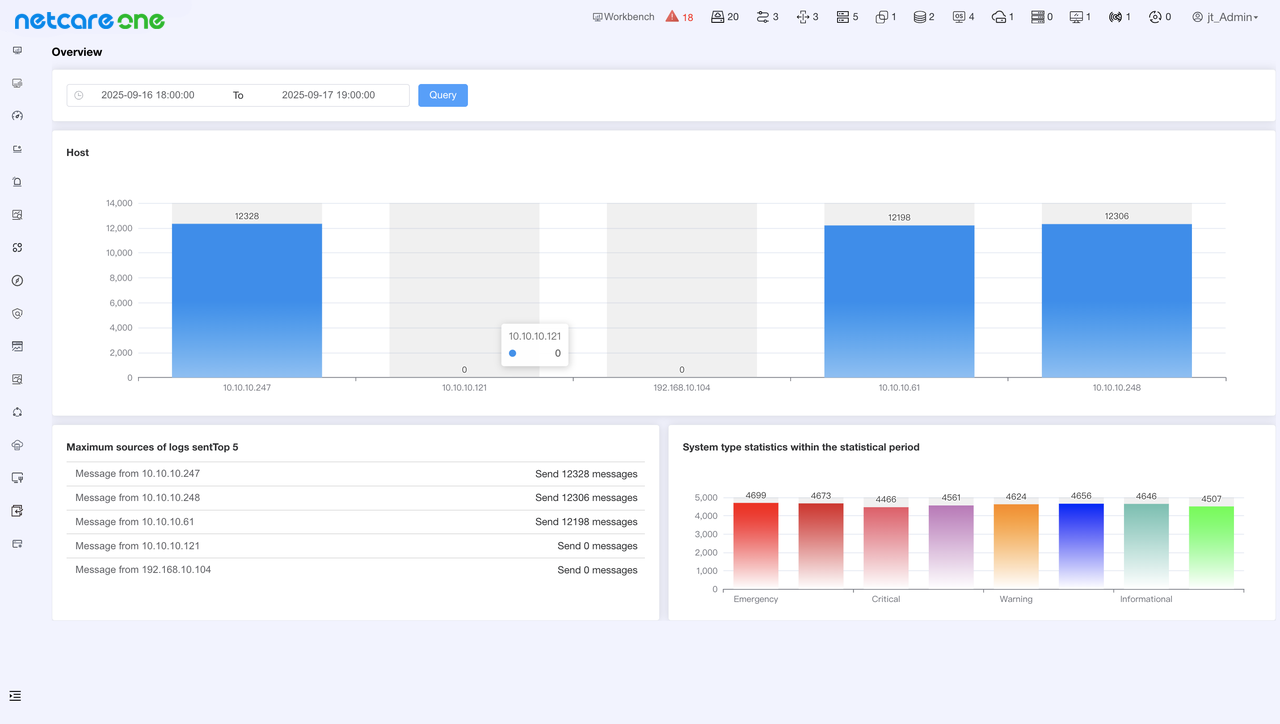
Syslog Monitoring
VISUAL:Get an at-a-glance Syslog dashboard with statistics and visual analysis of sources and time periods.
CENTRALIZED:View and export all Syslog records in one place, with support for CSV and HTML formats.
CONTROLLED:Easily add or remove devices under Syslog monitoring for flexible system management.
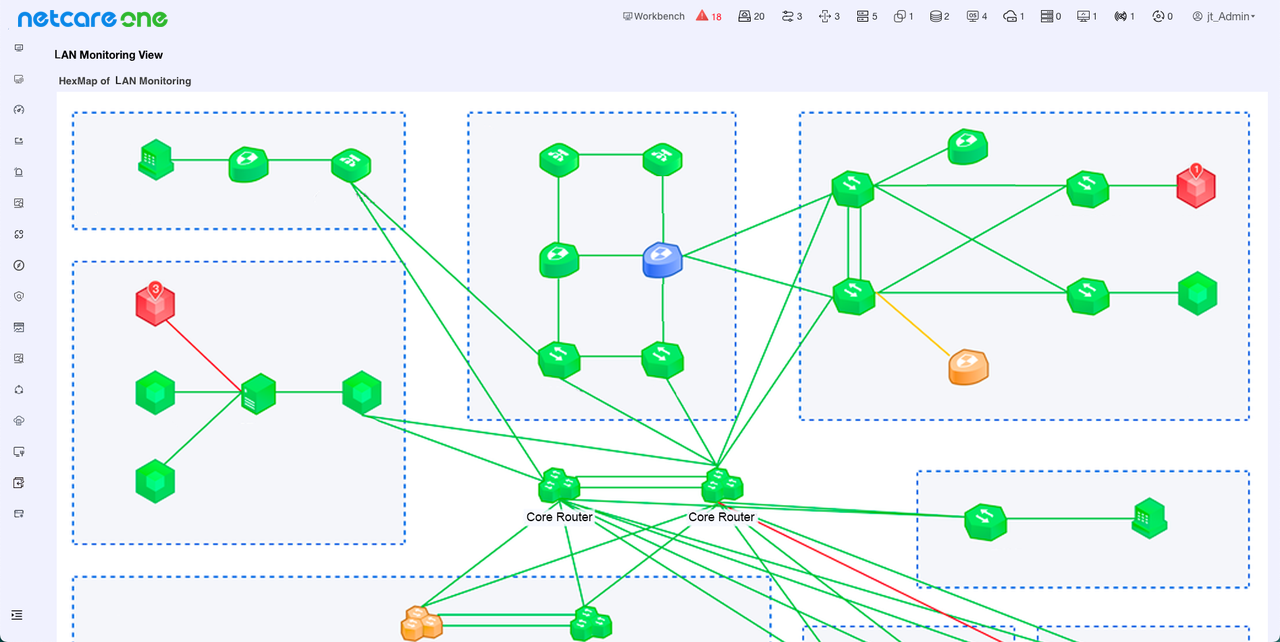
Topology Auto-Discovery
Automatically detects and visualizes network topology for seamless management and troubleshooting.

Real-Time Monitoring

Request a Quote Now
 Full Stack Monitoring
 Observability
 Automation
 Multi-channel Ticketing & Self-Service
 Incidents, Problems, Changes & Excellence
 Insights & Knowledge Management
 Configuration, Integration & Scalability
 Full Asset Lifecycle Visibility
 Comprehensive Asset & Contract Governance
 Open Integration & Data Interoperability
 Global Site Coordination
 Intelligent Ticketing Tracking
 Real-time Engineer Tracking
 A Single Device to Simplify Branch IT Operations
 Hardware Specifications
 Self-Service Q&A
 Intelligent Inventory Query
 Smart Report Generation
 Automated Spare Parts Requests
 Spare Parts Status Tracking
 Simplified Global CPE Deployment – Fast and Professional
 Worldwide On-Site Engineer Support – Stable and Reliable
 IT Operations and Management for Stores – Ensuring Business Continuity
 IT Infrastructure Delivery – Making Store Launches Easy and Controllable
 Enterprise-Grade Unified IT Operations – Secure and Efficient
 Network Lines Unified Management
 SD-WAN
 NaaS
NaaS Cisco Support
 HPE Support
 Aruba Support
 Fortinet Support
 Velocloud Support
 Meraki Support
 Oracle Support
 HP Support
 Dell Support
 Lenovo Support
 F5 Support
 End-to-End Enterprise ICT Operations Management
 Integrated Fully Managed Service For Network Lines
 An Integrated Smart Service Desk For Enterprises
 IoT for Retail Chains